I am currently pursuing a Bachelor of Technology in Computer Science with a specialization in Artificial Intelligence and Data Science. I have developed a strong proficiency in data analysis and possess a solid foundation in Data Structures and Algorithms (DSA) using Java.As a Data Analyst, I bring expertise in data visualization, statistical analysis, and problem-solving. I excel at transforming complex datasets into actionable insights that support data-driven decision-making
Create intuitive, custom dashboards to visualise your most important metrics. No coding or technical skills required.
Get the latest insights with real-time data refreshes. Stay on top of changes as they happen, keeping your team informed.
Set up automated reports to be delivered directly to your inbox. Save time and focus on making decisions, not creating reports.
Share dashboards and reports with your team for seamless collaboration. Comment, edit, and review data insights together.
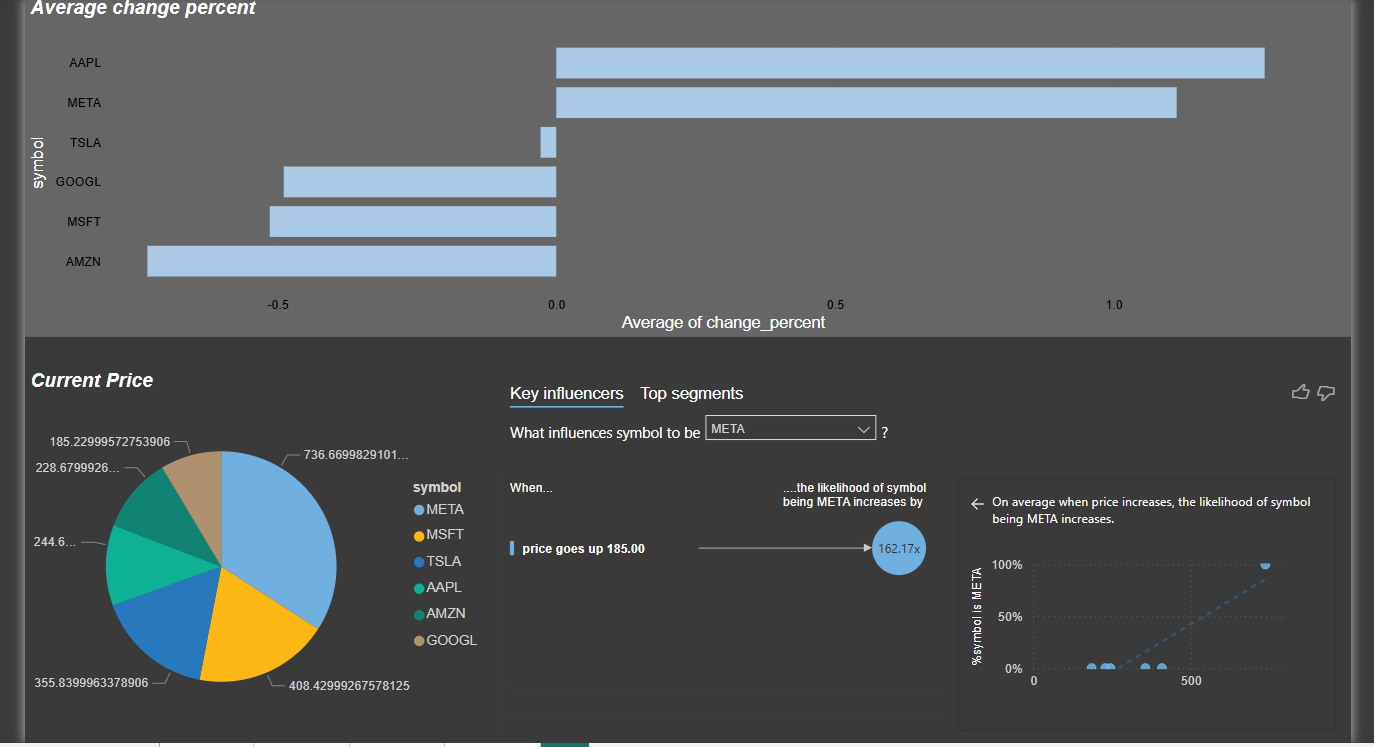
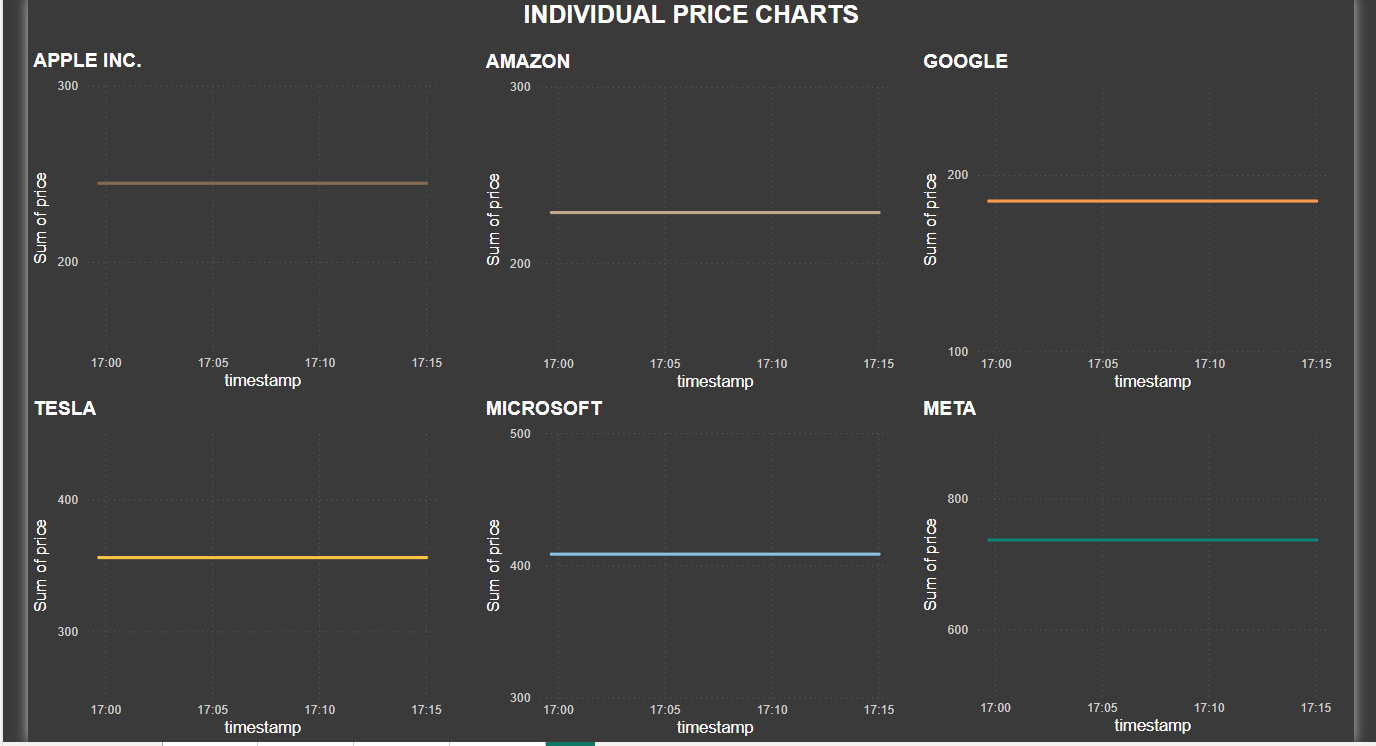
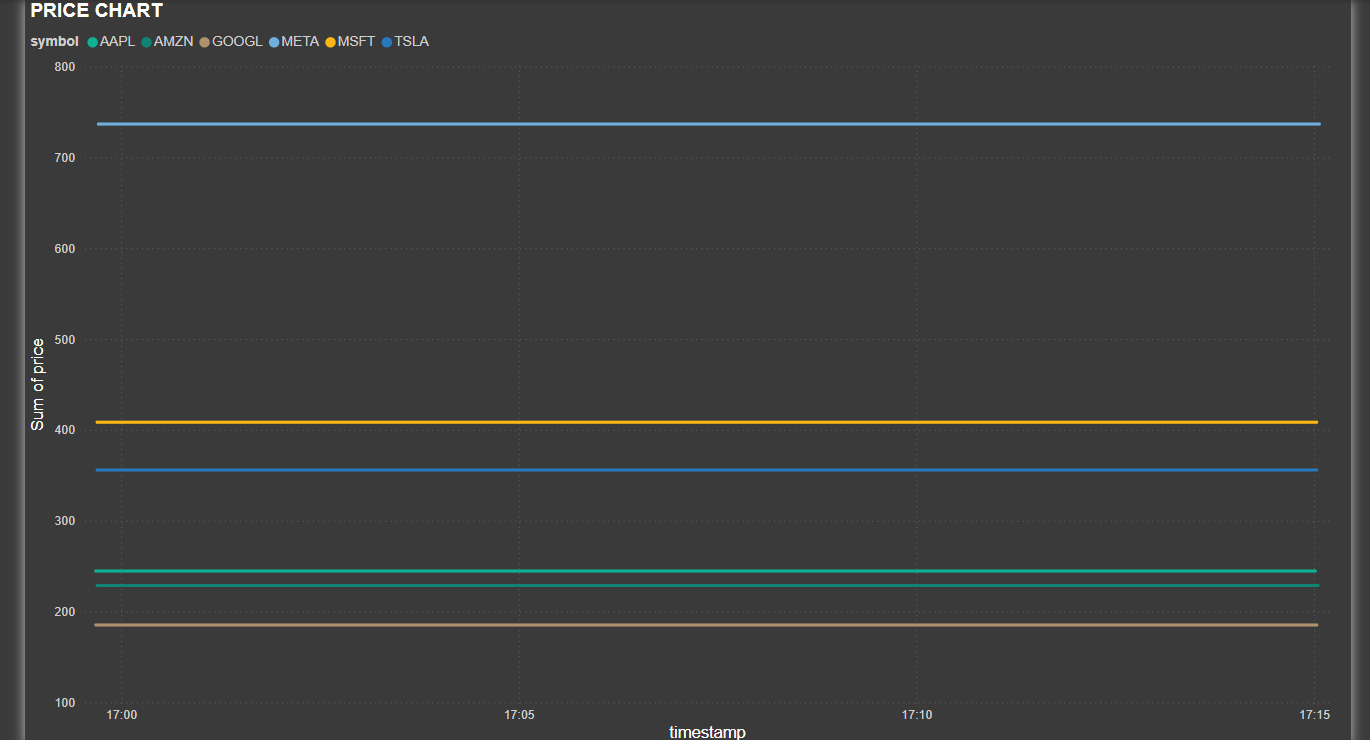
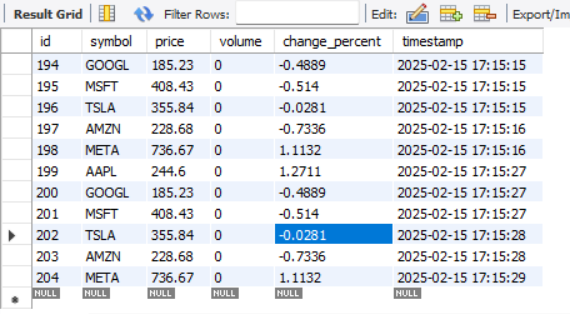
Python fetches real-time stock data using the Finnhub API and updates MySQL, which Power BI retrieves for dynamic stock market analysis.
Always stay up-to-date with live data flowing directly into your dashboard. Track changes as they happen with the help of finnhub APIs.
Power BI connects to MySQL, retrieves real-time stock data, processes insights, and visualizes trends dynamically for effective market analysis.
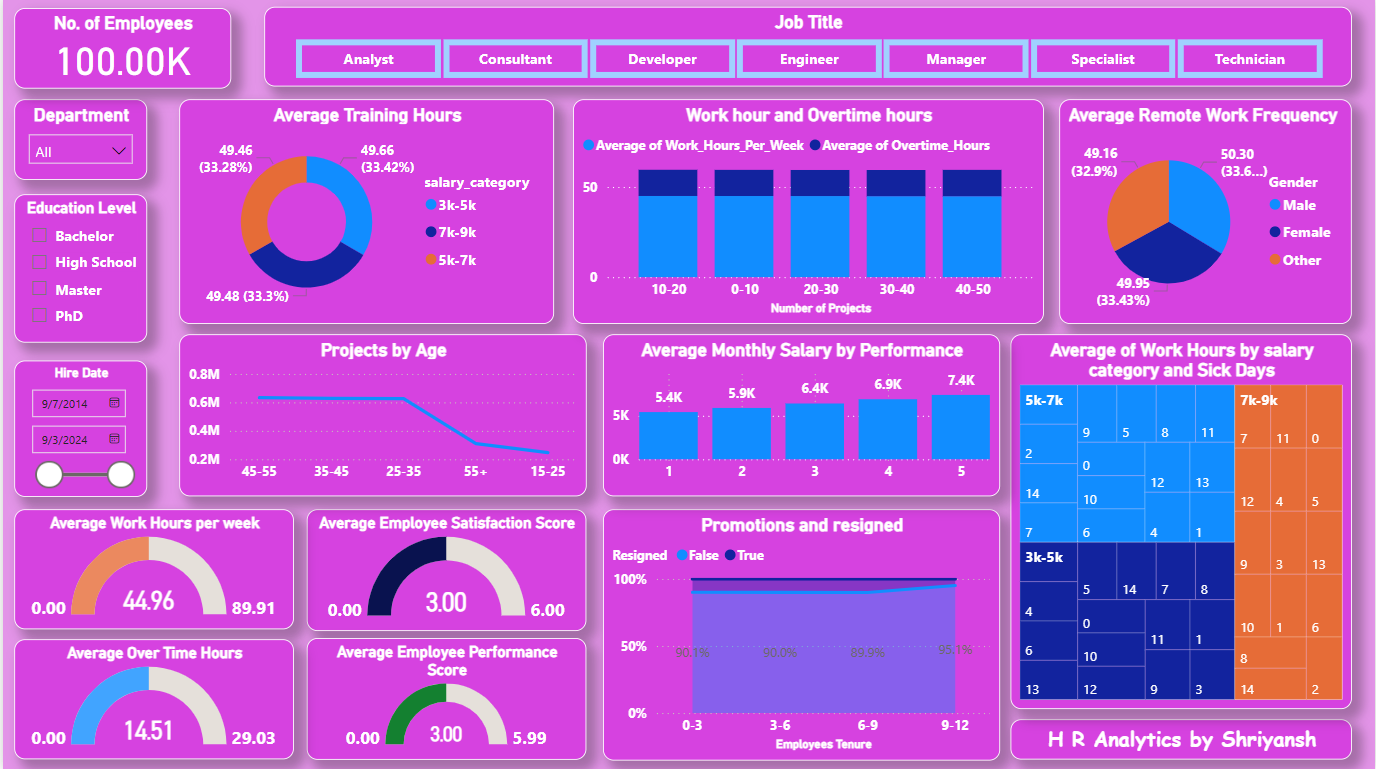
Data cleaning in employee analysis ensures accurate insights by removing duplicates, correcting errors, handling missing values, and standardizing formats. Excel simplifies data validation, transformation, and analysis.
Understanding and analysis involve interpreting data patterns, identifying trends, and extracting meaningful insights to support decision-making, optimize performance, and drive data-driven strategies effectively.
Interactive charts and filters enhance data analysis by allowing users to dynamically explore trends, compare metrics, and focus on specific insights using dropdowns, slicers, and drill-downs..
Answers to questions you might have about Me.
A Data Analyst gathers, cleans, and analyzes data to identify trends and provide actionable insights. They use SQL for database queries, Python for automation and statistical analysis, and tools like Power BI or Tableau for visualization. By creating interactive dashboards and reports, they help businesses make data-driven decisions. Their role also involves handling missing data, standardizing formats, and optimizing data pipelines to improve efficiency and accuracy
Programming : Python ( Numpy, Pandas, Matplotlib, Scikit- learn ), Java, SQL and C++(Basic).
Data Analysis Tools : Excel, Tableau, Power BI.
Machine Learning : Linear Regression, Logistic Regression, Decision Trees, Clustering, Classification.
Other data related skills are :
Data Collection & Extraction – Gathering data from APIs, databases, and external sources.
Data Cleaning & Preprocessing – Handling missing values, duplicates, and inconsistencies.
SQL & Database Management – Querying, filtering, and managing structured data.
Exploratory Data Analysis (EDA) – Identifying trends, patterns, and outliers.
Statistical Analysis – Using probability, regression, and hypothesis testing for insights.
Data Visualization – Creating dashboards with Power BI, Tableau, or Python (Matplotlib, Seaborn)
I am motivated to work regularly and efficiently because I am passionate about data analysis and solving complex problems. The ability to extract meaningful insights from data and create impactful solutions drives me to improve my skills. I am also driven by my problem-solving mindset, as I find satisfaction in optimizing workflows, automating tasks, and enhancing data accessibility. Ultimately, my dedication to continuous learning and career growth in AI and analytics keeps me motivated to work efficiently and consistently.
I have strong social skills that help me collaborate effectively and work efficiently in team environments. My experience in the Smart India Hackathon, where I reached the third round with a tourism and travel-based project, enhanced my ability to communicate ideas clearly, work under pressure, and coordinate with team members. I am confident in presenting insights, discussing analytical findings, and explaining technical concepts in a simple way. Additionally, I adapt well to new challenges, actively listen to others, and engage in meaningful discussions, making teamwork and collaboration more productive.
Data Analytics Job Simulation by Deloitte.
Investment Banking job simulation by J.P.Morgan.
Legacy Java Data and structure algorithms by Freecodecamp.
Excel for Beginners by Great Learning
Data Analysis with python by Freecodecamp.
Data Visualization With Power BI by Great Learning.